
In Part 1 of this Blog post, I described the hardware setup of my LoRaWAN Lab. But the End Nodes and the Gateway is only one-half of a complete LoRaWAN setup. The Things Network shows the whole architecture:
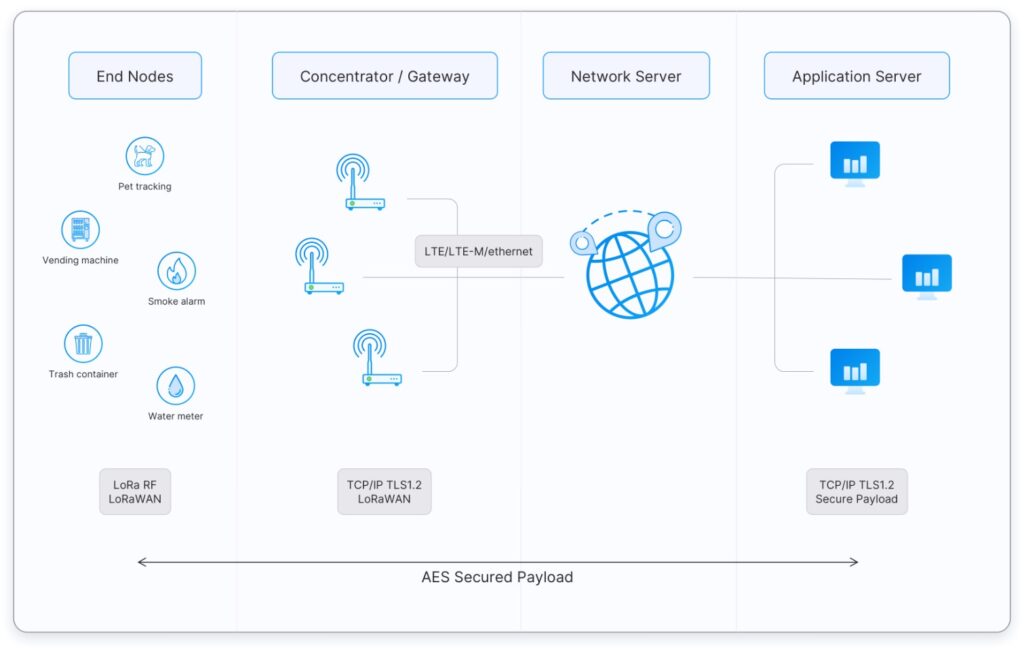
Image from https://www.thethingsnetwork.org/docs/lorawan/architecture/
This post is not meant to provide detailed setup instructions. See it as an idea for building a Lab setup with LoRaWAN.
The general setup
I used “The Things Network” for the Network server, which we also used in the LoRaWAN boot camp at WLPC. It’s a free service without SLAs, but it’s fine for practicing and learning. They have a commercial offer, “The Things Industries”, for production environments.
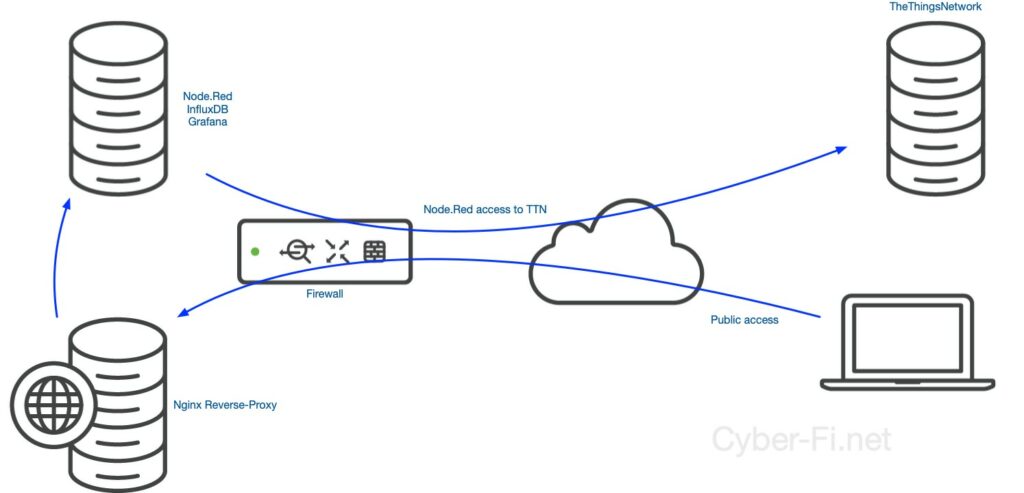
In the boot camp, we installed Node.Red, Influx, and Grafana on the RaspberryPi that also runs the Gateway. For my setup, I use two VMs, one hosting Node.Red, the Influx DB, and the Grafana dashboard, and one VM hosting the NGINX reverse proxy for the dashboard access. I probably would use four or five VMs or containers to separate all services for a production environment, but that seemed a little overkill for this Lab.
This is my setup of how I run it:
This is the setup how I ideally would like to run it:
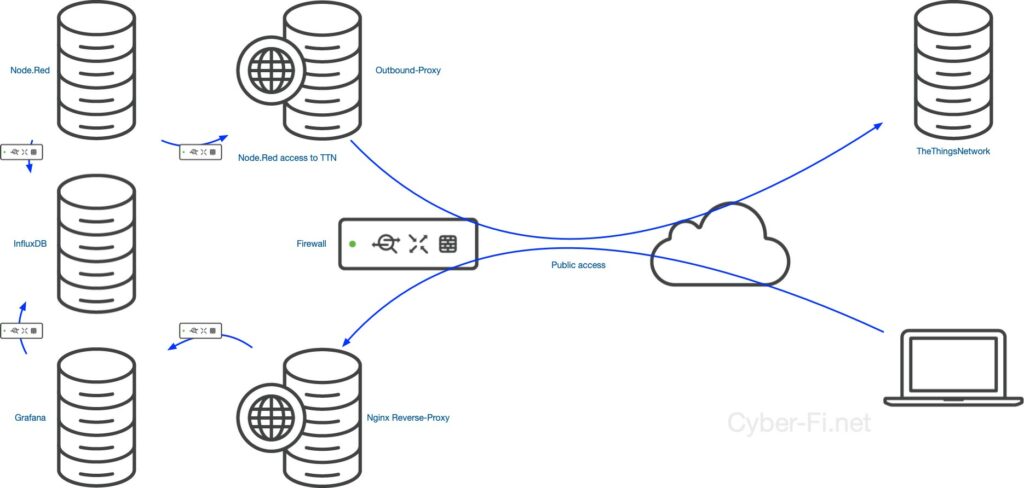
Perhaps I’ll change it later to this setup but with only one firewall between all subnets.
The Gateway Setup
The gateway software itself has to be installed and needs to connect to TTN. For the RaspberryPi-based Gateway from RAKwireless, the software with the installation procedure is available on Github:
https://github.com/RAKWireless/rak_common_for_gateway
RAKwireless has very extensive documentation for all that they build:
https://github.com/RAKWireless/rakwireless-docs
https://docs.rakwireless.com/Knowledge-Hub/Learn/Raspberry-Pi-and-RAK-LPWAN-Concentrators/
The software adds two new commands to the system:
gateway-config to configure the channel plan and select the correct network server
gateway-version to show the gateway ID that we need in the next step
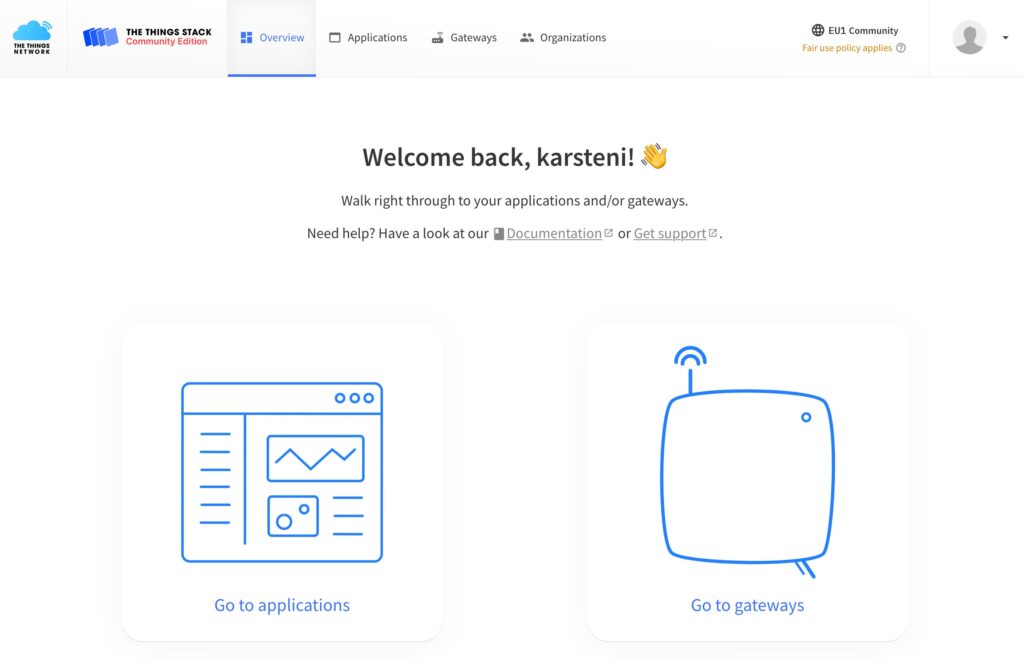
The Network Server
Setting up an account with The Things Network (TTN) is easy, and after logging in to the console, you get a nice dashboard to add your gateways and end devices:
The process of adding a Gateway is described in the TTN documentation:
https://www.thethingsindustries.com/docs/gateways/concepts/adding-gateways/
While setting up your Gateway, a name, the unique gateway ID, and the channel plan must be entered. The gateway ID and channel plan have to match the gateway setup.
The next step on the Network server is to create an Application:
https://www.thethingsindustries.com/docs/integrations/adding-applications/
The Application in TTN is a “container “for end devices (sensors, actuators) that share common access and integrations. I added one Application for the temperature sensors and one for the power plug.
The registration of end devices is again described in the TTN documentation:
https://www.thethingsindustries.com/docs/devices/adding-devices/
After the devices are added (and configured), we’ll get messages from the devices, but these messages are not decoded correctly. Every device vendor can decide what to send and how to send it.
The “translation” is done with Payload formatters, which can be downloaded from the vendor’s sites.
This is for the Power plug:
https://github.com/Milesight-IoT/SensorDecoders/tree/main/WS_Series/WS52x
This is for the Dragino devices:
https://github.com/dragino/dragino-end-node-decoder
Both vendors have extensive documentation for their systems:
http://wiki.dragino.com/xwiki/bin/view/Main/User%20Manual%20for%20LoRaWAN%20End%20Nodes/
https://www.milesight.com/iot/product/lorawan-sensor/ws523
Let’s look at an example for the Dragino LHT52:
if(port==2)
{
  if(bytes.length==11)
  {
    decode.TempC_SHT=parseFloat(((bytes[0]<<24>>16 | bytes[1])/100).toFixed(2));
    decode.Hum_SHT=parseFloat(((bytes[2]<<24>>16 | bytes[3])/10).toFixed(1));
    decode.TempC_DS=parseFloat(((bytes[4]<<24>>16 | bytes[5])/100).toFixed(2));
    decode.Ext=bytes[6];
    decode.Systimestamp=(bytes[7]<<24 | bytes[8]<<16 | bytes[9]<<8 | bytes[10] );
    return decode;
  }
}
The real-time sensor values are sent as 11 bytes:
- Two bytes temperature
- Two bytes humidity
- Two bytes external temperature
- One byte that defines the external sensor
- Four bytes Unix Timestamp
The decoder is readily available on Github, but everything to build a formatter is in the documentation:
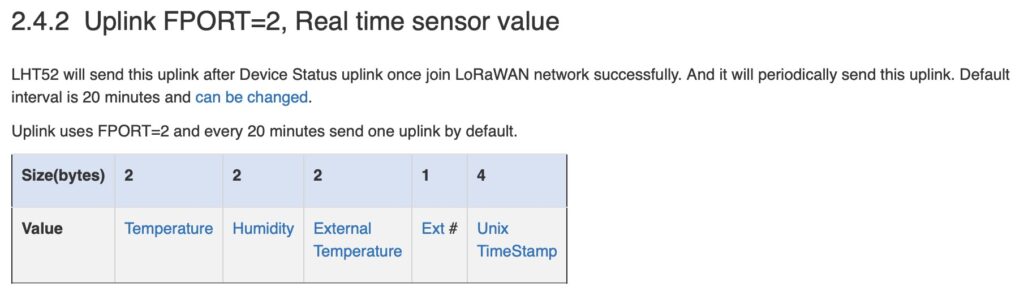
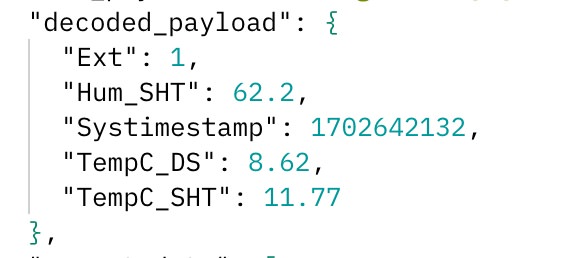
With the correct payload formatter, the data is shown correctly in TTN:
An MQTT integration must be configured to get the data into the IoT server. The FQDN, username, and API key (password) are required when configuring the application logic in Node-Red.
The IoT Server
The IoT server (also named Application Server) consists of the following components:
Influx to store the measurements
Node-Red to build the application logic, receive the measurements from TTN, and store the data in Influx
Grafana will present the data from the Influx database to the user.
Installing InfluxDB:
In the boot camp, we used InfluxDB version 1.8 for compatibility reasons. I continued with this version for my Lab to avoid any struggle in building this Lab.
Download:
https://www.influxdata.com/downloads/
InfluxDB v1 documentation:
https://docs.influxdata.com/influxdb/v1/
A user and a database must be configured, not the database structure. Influx will store what Node-Red sends to the database.
Installing Node-Red:
The installation procedure is described on the Node-Red website:
https://nodered.org/docs/getting-started/raspberrypi
Building the Application Logic is the most challenging task.
This is my logic for the temperature sensor:
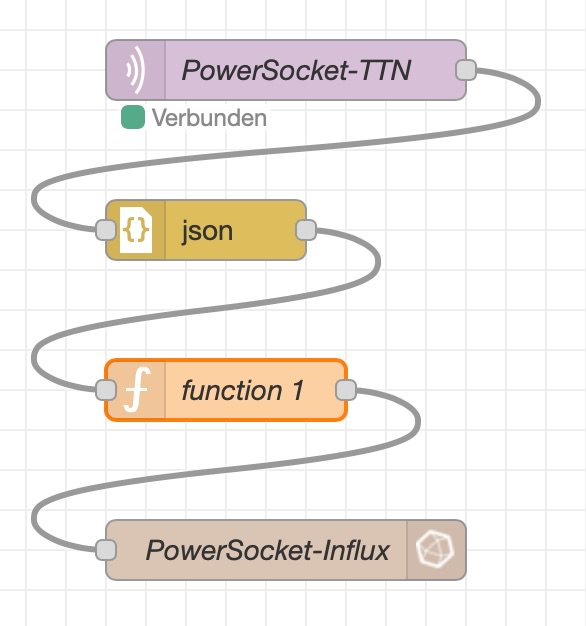
The flow is the following:
- MQTT receives the data from TTN
- The data is converted between JSON string and Javascript object
- The function uses the data in the object and returns an object
- The new object is written to the influx database
My function is the following:
if (typeof msg.payload.uplink_message.decoded_payload != "undefined") {
    msg.payload = {
        device: msg.payload.end_device_ids.device_id,
        temp_ext: msg.payload.uplink_message.decoded_payload.TempC_DS,
        temp_int: msg.payload.uplink_message.decoded_payload.TempC_SHT,
        humidity_int: msg.payload.uplink_message.decoded_payload.Hum_SHT,
        rssi: msg.payload.uplink_message.rx_metadata[0].rssi,
        snr: msg.payload.uplink_message.rx_metadata[0].snr,
        sf: msg.payload.uplink_message.settings.data_rate.lora.spreading_factor
    }
    return msg;
}
The msg.payload is set based on the uplink message:
    "uplink_message": {
      "session_key_id": „xxx“,
      "f_port": 2,
      "f_cnt": 1847,
      "frm_payload": "BF8CawMNAWV8LxQ=",
      "decoded_payload": {
        "Ext": 1,
        "Hum_SHT": 61.9,
        "Systimestamp": 1702637332,
        "TempC_DS": 7.81,
        "TempC_SHT": 11.19
      },
      "rx_metadata": [
        {
          "gateway_ids": {
            "gateway_id": "eui-xxx“,
            "eui": „xxx“
          },
          "time": "2023-12-15T10:49:02.485Z",
          "timestamp": 2958783650,
          "rssi": -36,
          "channel_rssi": -36,
          "snr": 12,
          "frequency_offset": "198",
          "location": {
            "latitude": 53.869434814552,
            "longitude": 10.6693411165392,
            "source": "SOURCE_REGISTRY"
          },
          "uplink_token": „xxx“,
          "channel_index": 2,
          "gps_time": "2023-12-15T10:49:02.485Z",
          "received_at": "2023-12-15T10:46:48.286527369Z"
        }
      ],
I am not interested in every field; I only want to write the device ID (because I have two temperature sensors), the two measured temperatures, the humidity, and LoRa statistics like RSSI, SNR, and spreading factor to the database. The rest of the data is ignored.
Installing Grafana:
Same as with Influx and Node-Red, the right package is selected and installed:
https://grafana.com/oss/grafana/?pg=oss-graf
In Grafana, the InfluxDB is added as a Data Source and a Visualisation is built for the dashboard.
My dashboard is far from ready, but I have one for my Gateway and one for the power plug.
For the Gateway, my main concern was the temperature.
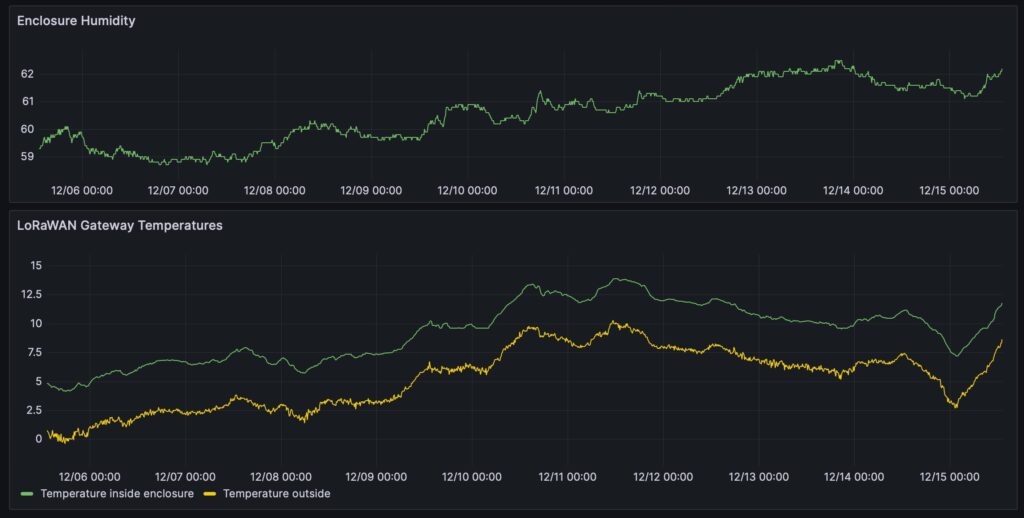
It was not that cold up to now, but I can see that the temperature inside of the enclosure is typically 3,5 degrees warmer than outside. I am waiting for the cold weather with minus 10 to minus 20 degrees to see what happens with my Gateway.
RSSI, SNR, and SF are dull, with the sensor in the same enclosure as the Gateway.
But these measurements are interesting for the power plug as the weak reception was the reason for the outdoor enclosure and the extra antenna:
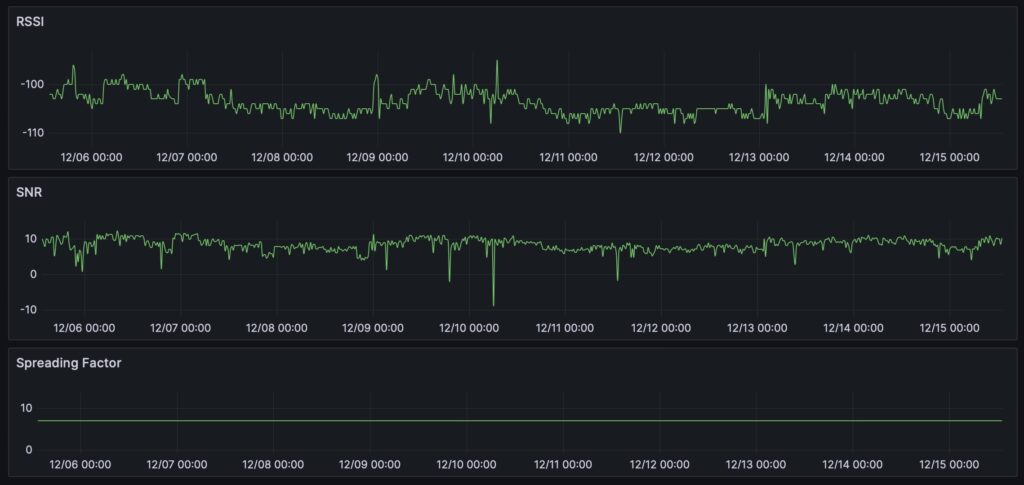
And this looks quite good (well, it’s LoRaWAN and not Wi-Fi).
What comes next:
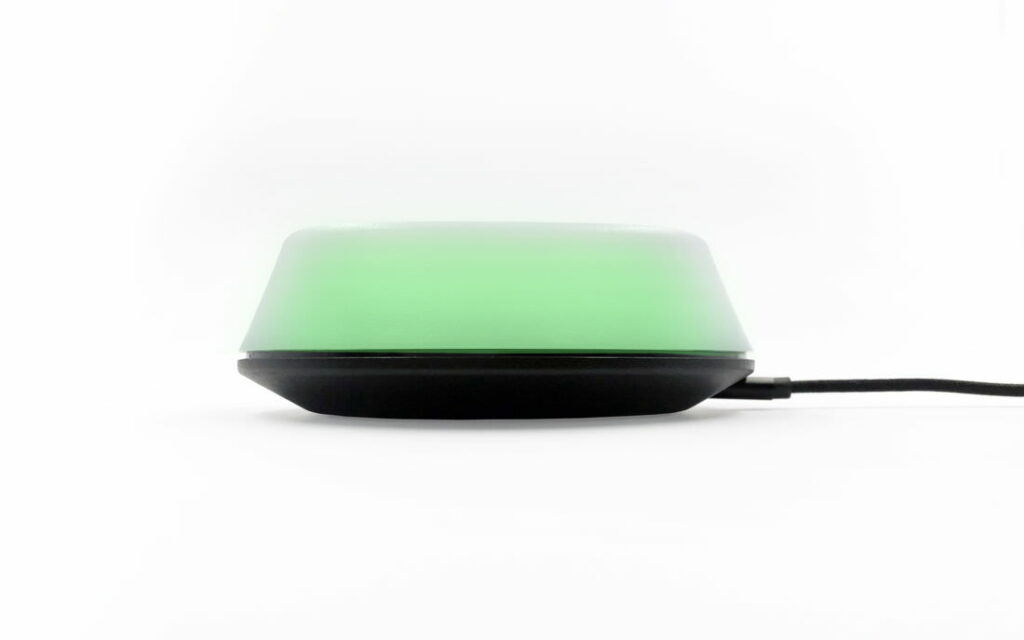
To-Do #1: I still need some notification when the power for the fridge fails. And there are so many options:
- miro Alarm from miromico that turns red when power fails. This is also a LoRaWAN device, and the color is completely customizable: https://miromico.ch/miro-alarm
- I could send an API call to my Meraki Dashboard and let all switch LEDs blink. No, that is not my preferred option.
- Sending a message to Webex or Telegram?
- Push notification to my mobile.
I’ll likely go with push notifications; multiple options are available. After doing some research, my two favorites are:
Remote-red: https://www.remote-red.com
SimplePush: https://simplepush.io
But I have not decided yet which one to use.
To-Do #2: In Node-Red, I am not writing a timestamp to the database; Influx automatically adds the timestamp. This is likely no problem, but I would like to add either the timestamp from the device or the Gateway. For that, I still have to figure out what the device timestamp is (there is no NTP or something similar on the device) and how the timestamp is ideally written to Influx. Yes, there is room for improvement!
While writing these sentences, I realized that “gps_time” and “received_at” in the shown msg.payload differ by over two minutes, although the RaspberryPi receives its time by NTP. I need to find out what is going wrong here.
To-Do #3: Running an older version of InfluxDB bothers me. I need to find out what to change to go with up-to-date versions.
And your next step? Attending the WirelessLan Professional Conference (WLPC) with the LoRaWAN boot camp is likely the best.
This concludes Part 2 with the software setup. I’ll add more posts when implementing more elements or if there is interesting news about this setup.